


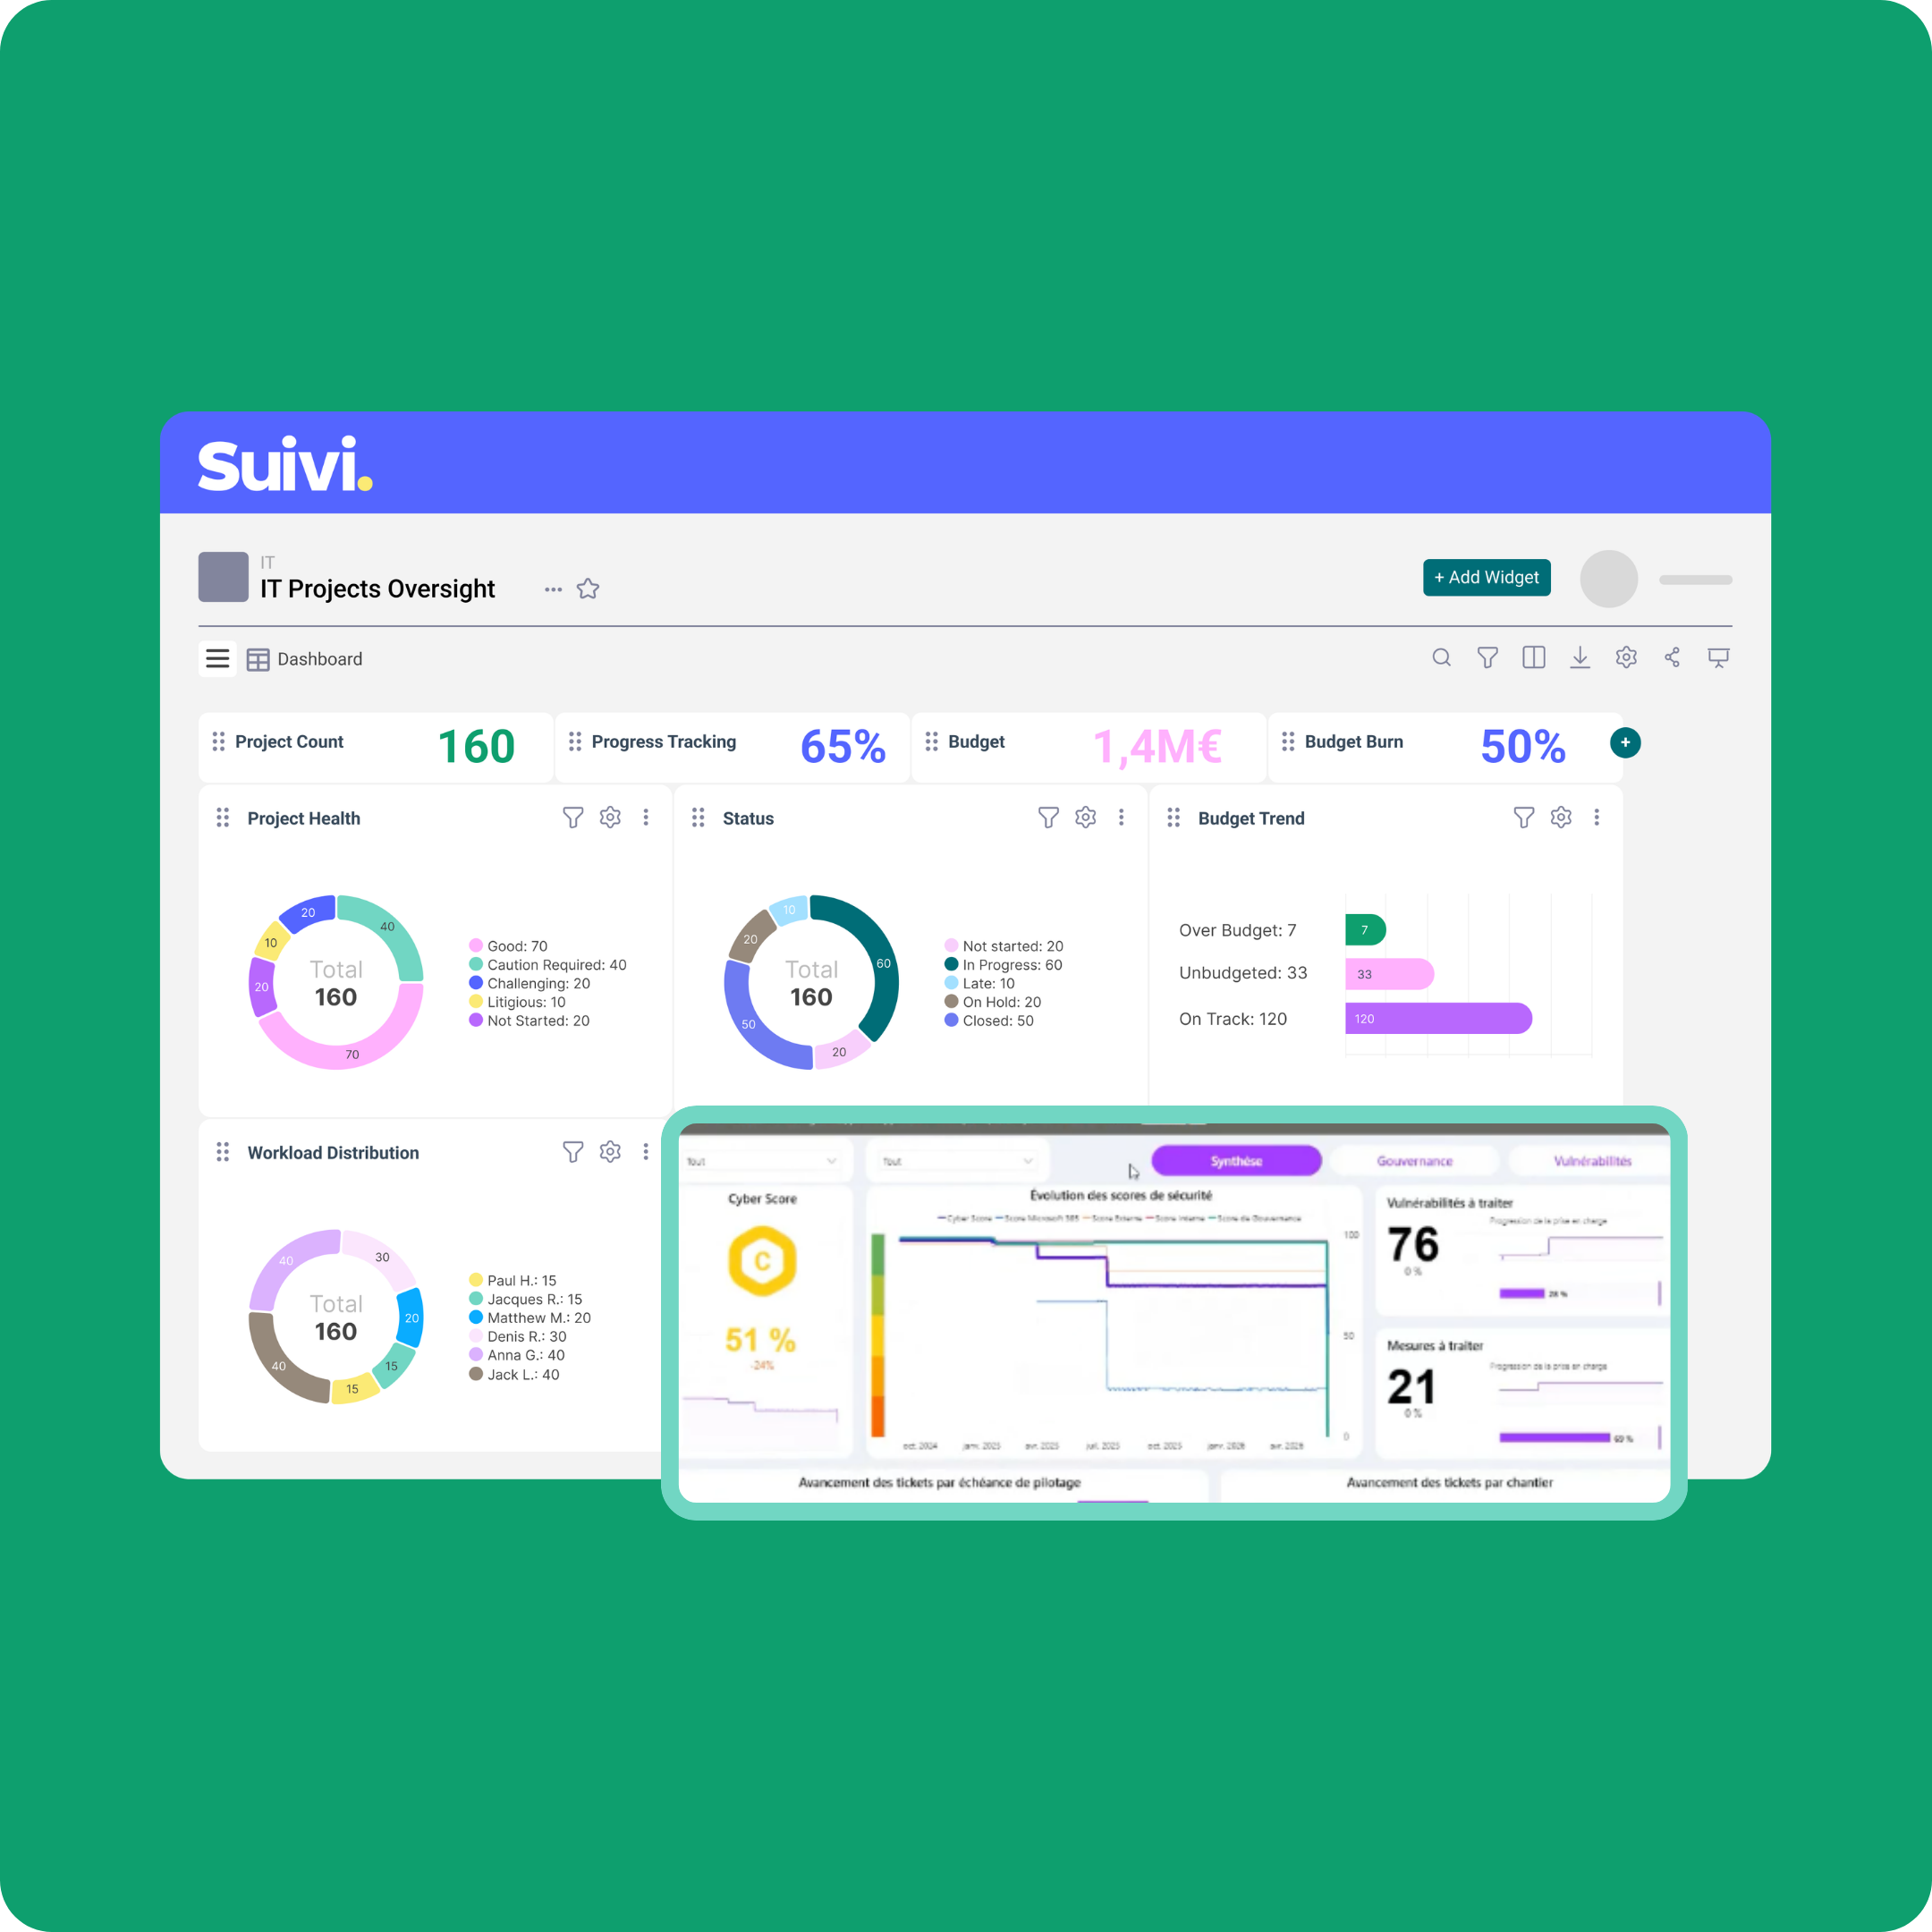
Your financial KPIs live in Power BI, your project tracking lives in Suivi, and in between... a dozen open tabs, stale screenshots, and meetings where you spend more time hunting for numbers than analyzing them. The Power BI widget changes everything: your Microsoft reports show up right in your Suivi dashboards and portals, always up to date.
The promise: no more back-and-forth between your data and your decisions
Suivi has one ambition: to be the management tool that runs on a complete view of your data to drive better decisions. But every organization handles its data its own way, and some information, whether financial or strategic, is meant to live in other tools, like Power BI.
The PowerBI widget brings the two together. Your reports stay in Power BI, with their access rules and edit rights intact. Suivi becomes the window onto them, right in the boards and portals where your team plans and decides. The result: a 360° view of your data, without bypassing your governance.
The feature: a widget (almost) like any other
No complex setup: add it like any other widget to your dashboards and portal home pages.
Prerequisites
Users must be authenticated on the Microsoft tenant connected to Suivi and have Power BI permissions on the content they want to display. Beforehand, at the organization level, a Microsoft 365 admin must have consented to the connection with Suivi.
What you configure
- The PowerBI workspace that holds the data.
- The reports and report pages eto be displayed. If no page is selected, the Power BI report's default page shows up, along with its navigation.
- The connection mode (see below).
- The canvas' dimensions, from the Appearance tab.
Two connection modes
Pick the connection mode that fits your context.
- User mode: the widget only shows Power BI reports the signed-in user has access to. If the board is shared, each person needs their own access to the embedded Power BI report to see its contents. So the same widget can show a partial or empty report, depending on who's looking.
- Embedded in board mode: the widget relies on the Suivi app's permissions. Handy when you need everyone with access to your board or portal to see the same report, regardless of their individual Power BI rights.
Either way, the widget never creates new authorizations: it follows your existing Microsoft and PowerBI's rules.
What's it really for?
Performance reviews (leadership & managers)
You display company-wide KPIs (revenue, margin, workload, quality, NPS...) on your project-steering dashboard. And in committee meetings, you explore the report without leaving Suivi or hunting for the right tab.
Operations tracking: production, supply chain, quality
Embed your Power BI reports on scrap, incidents, non-conformities, lead times, OEE... right in the team's board. Data and actions in one place: decisions happen faster.
Delivery & project management: PMOs, project managers
Display your progress reporting (burndown, budget burn, capacity, risks) in the project's Dashboard view. The dashboard becomes the single source of truth during your team rituals.
Support & Customer Success
Centralize your ticket metrics (volume, SLAs, root causes, satisfaction) in a team portal or a "Run" board. Reading KPIs and prioritizing actions happen in the same space.
Internal communication portals
On a portal home page, a "Key metrics" widget makes information available to a wider audience, depending on the chosen mode and existing permissions.
The result: fewer tabs, better decisions
Two situations where the widget really shines
- Your strategic data (finance, HR, sales, etc.) stays in Power BI for governance reasons. The widget lets you display it alongside your Suivi tracking data, without moving or duplicating it.
- You need to combine your data with a customer's or partner's. Instead of juggling multiple sources, display their Power BI reports in Suivi, next to your own metrics. One view, all the context.
Three things to remember:
- faster decisions: your KPIs sit right next to the work you're managing;
- always-fresh reporting: the widget displays the live report, not a frozen screenshot;
- security intact: the widget relies on existing Microsoft permissions. Suivi grants no extra access.
More productive meetings
No more prepping screenshots or opening Power BI on the side. The report is right there, live, in Suivi. Analyze, decide, move on.
Easier reporting adoption
Reporting comes to users in their usual workspace, no separate tool required. Less friction, better adoption.
Manage with the full picture
Internal data, partner or customer data, operational and strategic metrics: it all shows up in one space.