
Better ops. Happier clients.
Managing emergencies, minimizing delays, keeping customers happy... and one key factor: proactivity.
With Suivi, identify your priorities at a glance and run your business with zero blind spots. Your customers will thank you.
Goodbye, firefighting mode.
Heading
Heading 1
Heading 2
Heading 3
Heading 4
Heading 5
Heading 6
Lorem ipsum dolor sit amet, consectetur adipiscing elit, sed do eiusmod tempor incididunt ut labore et dolore magna aliqua. Ut enim ad minim veniam, quis nostrud exercitation ullamco laboris nisi ut aliquip ex ea commodo consequat. Duis aute irure dolor in reprehenderit in voluptate velit esse cillum dolore eu fugiat nulla pariatur.
Block quote
Ordered list
- Item 1
- Item 2
- Item 3
Unordered list
- Item A
- Item B
- Item C
Bold text
Emphasis
Superscript
Subscript


.png)
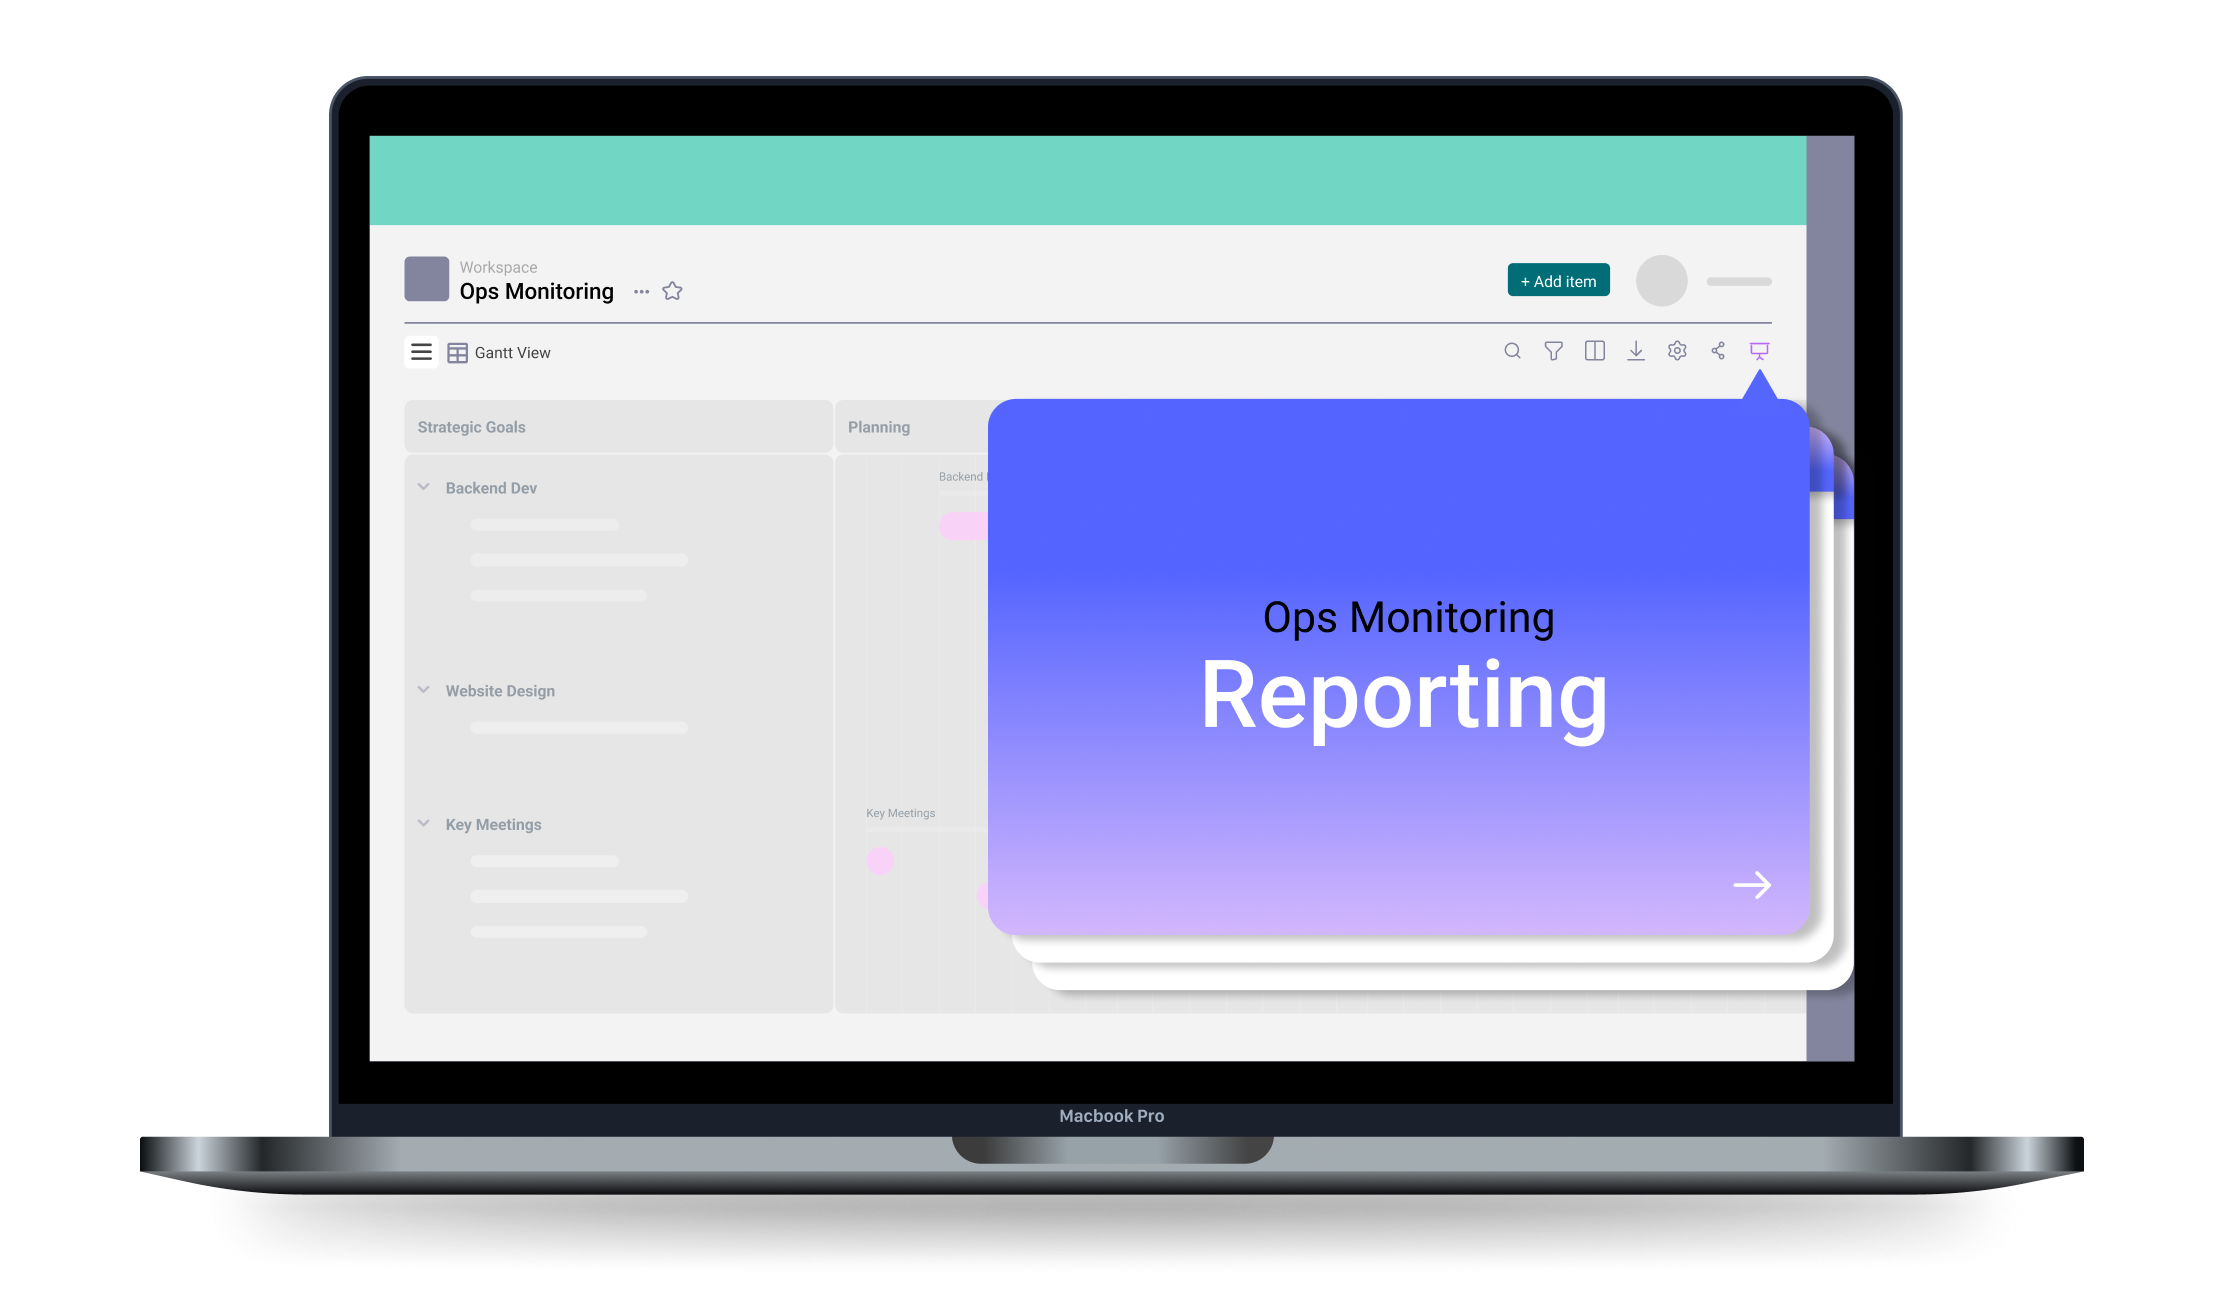
Reporting in Two Clicks!
Provide management with a clear, up-to-date view of interventions… without spending hours.
- Share read-only dashboard access to give a global, always-current perspective.
- Generate slides in one click and project them directly from Suivi for executive or management reporting.
Want to know more?
Time to cut the fluff — let’s talk. Wondering if Suivi fits your needs? Want a deeper look at what it can do? Our team is here for you.
Fot technical support, visit our Help Center.
Everything You Need to Know About Our Operations Management Tool
Our customer service is overwhelmed. How can we classify and view requests by geographic area or priority?
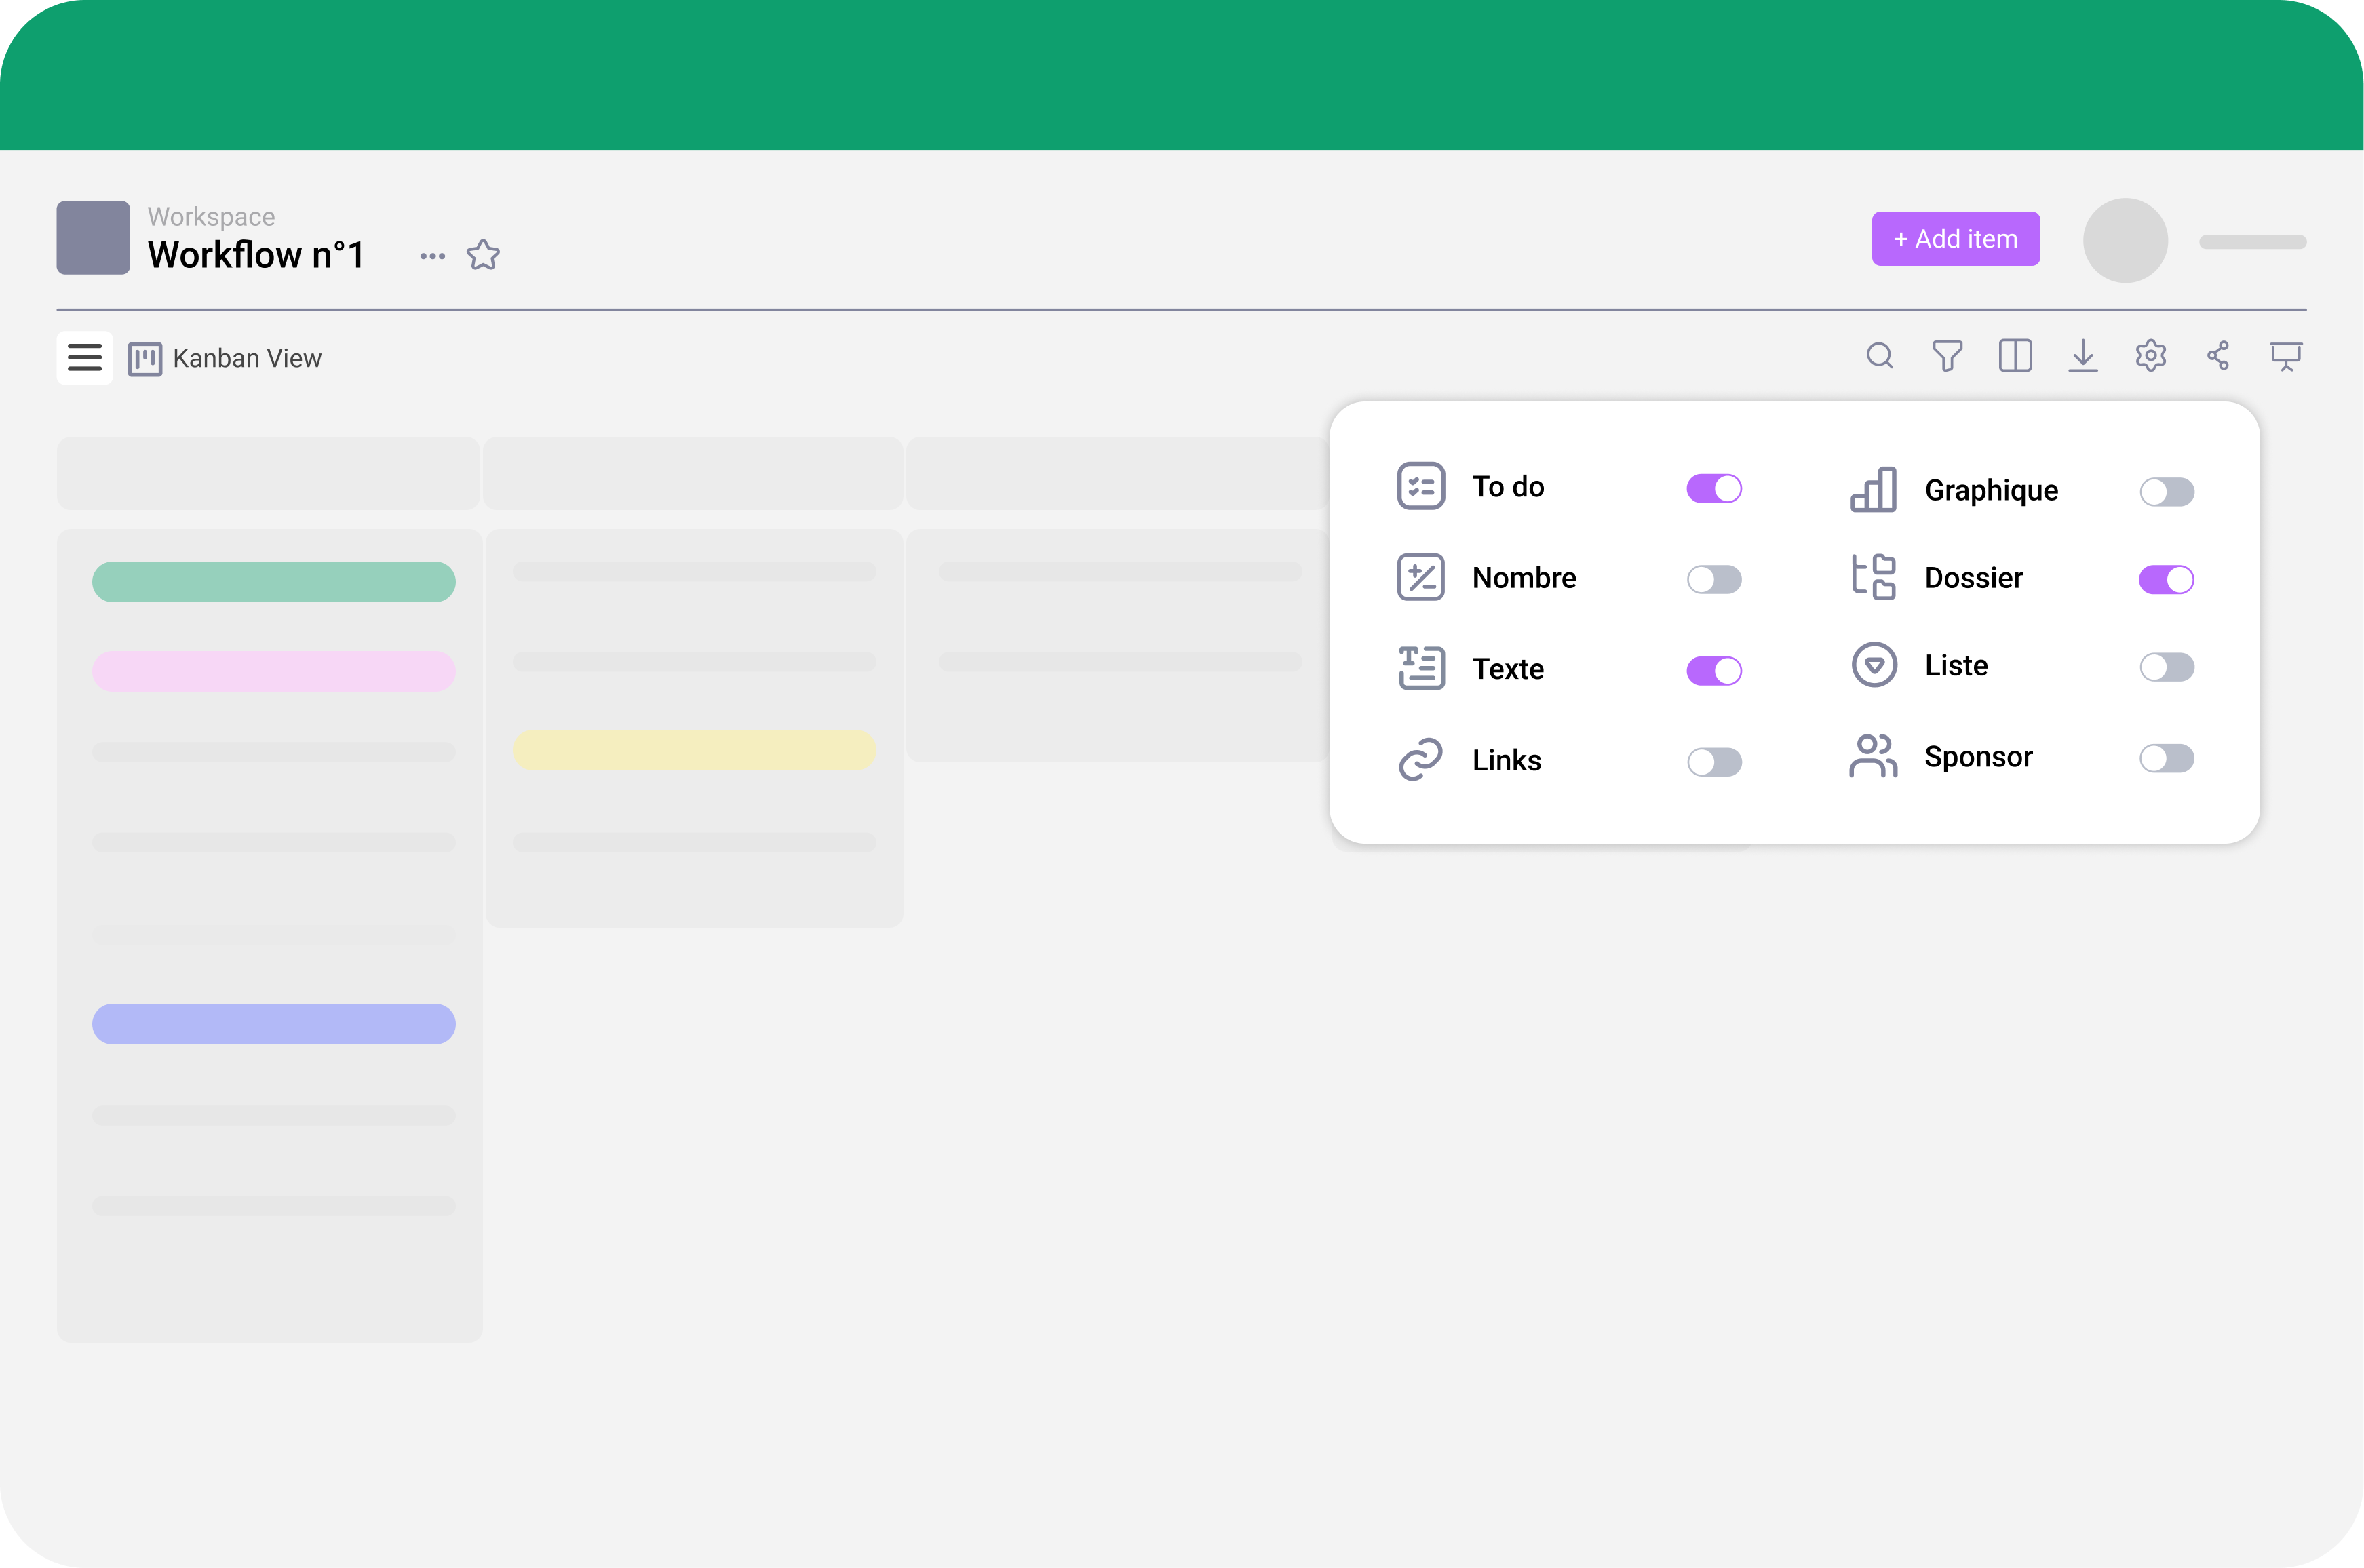
Suivi offers maximum flexibility to organize service requests. Add as many attributes as needed (client, region, priority, urgency, type of request…) and assign distinct processes or owners directly in your project tracking boards.
Bonus: You can build no-code dashboards to visualize everything. Yes, really!
How does Suivi help avoid the most common financial risk: late penalties?
Several features make managing interventions and meeting deadlines easier:
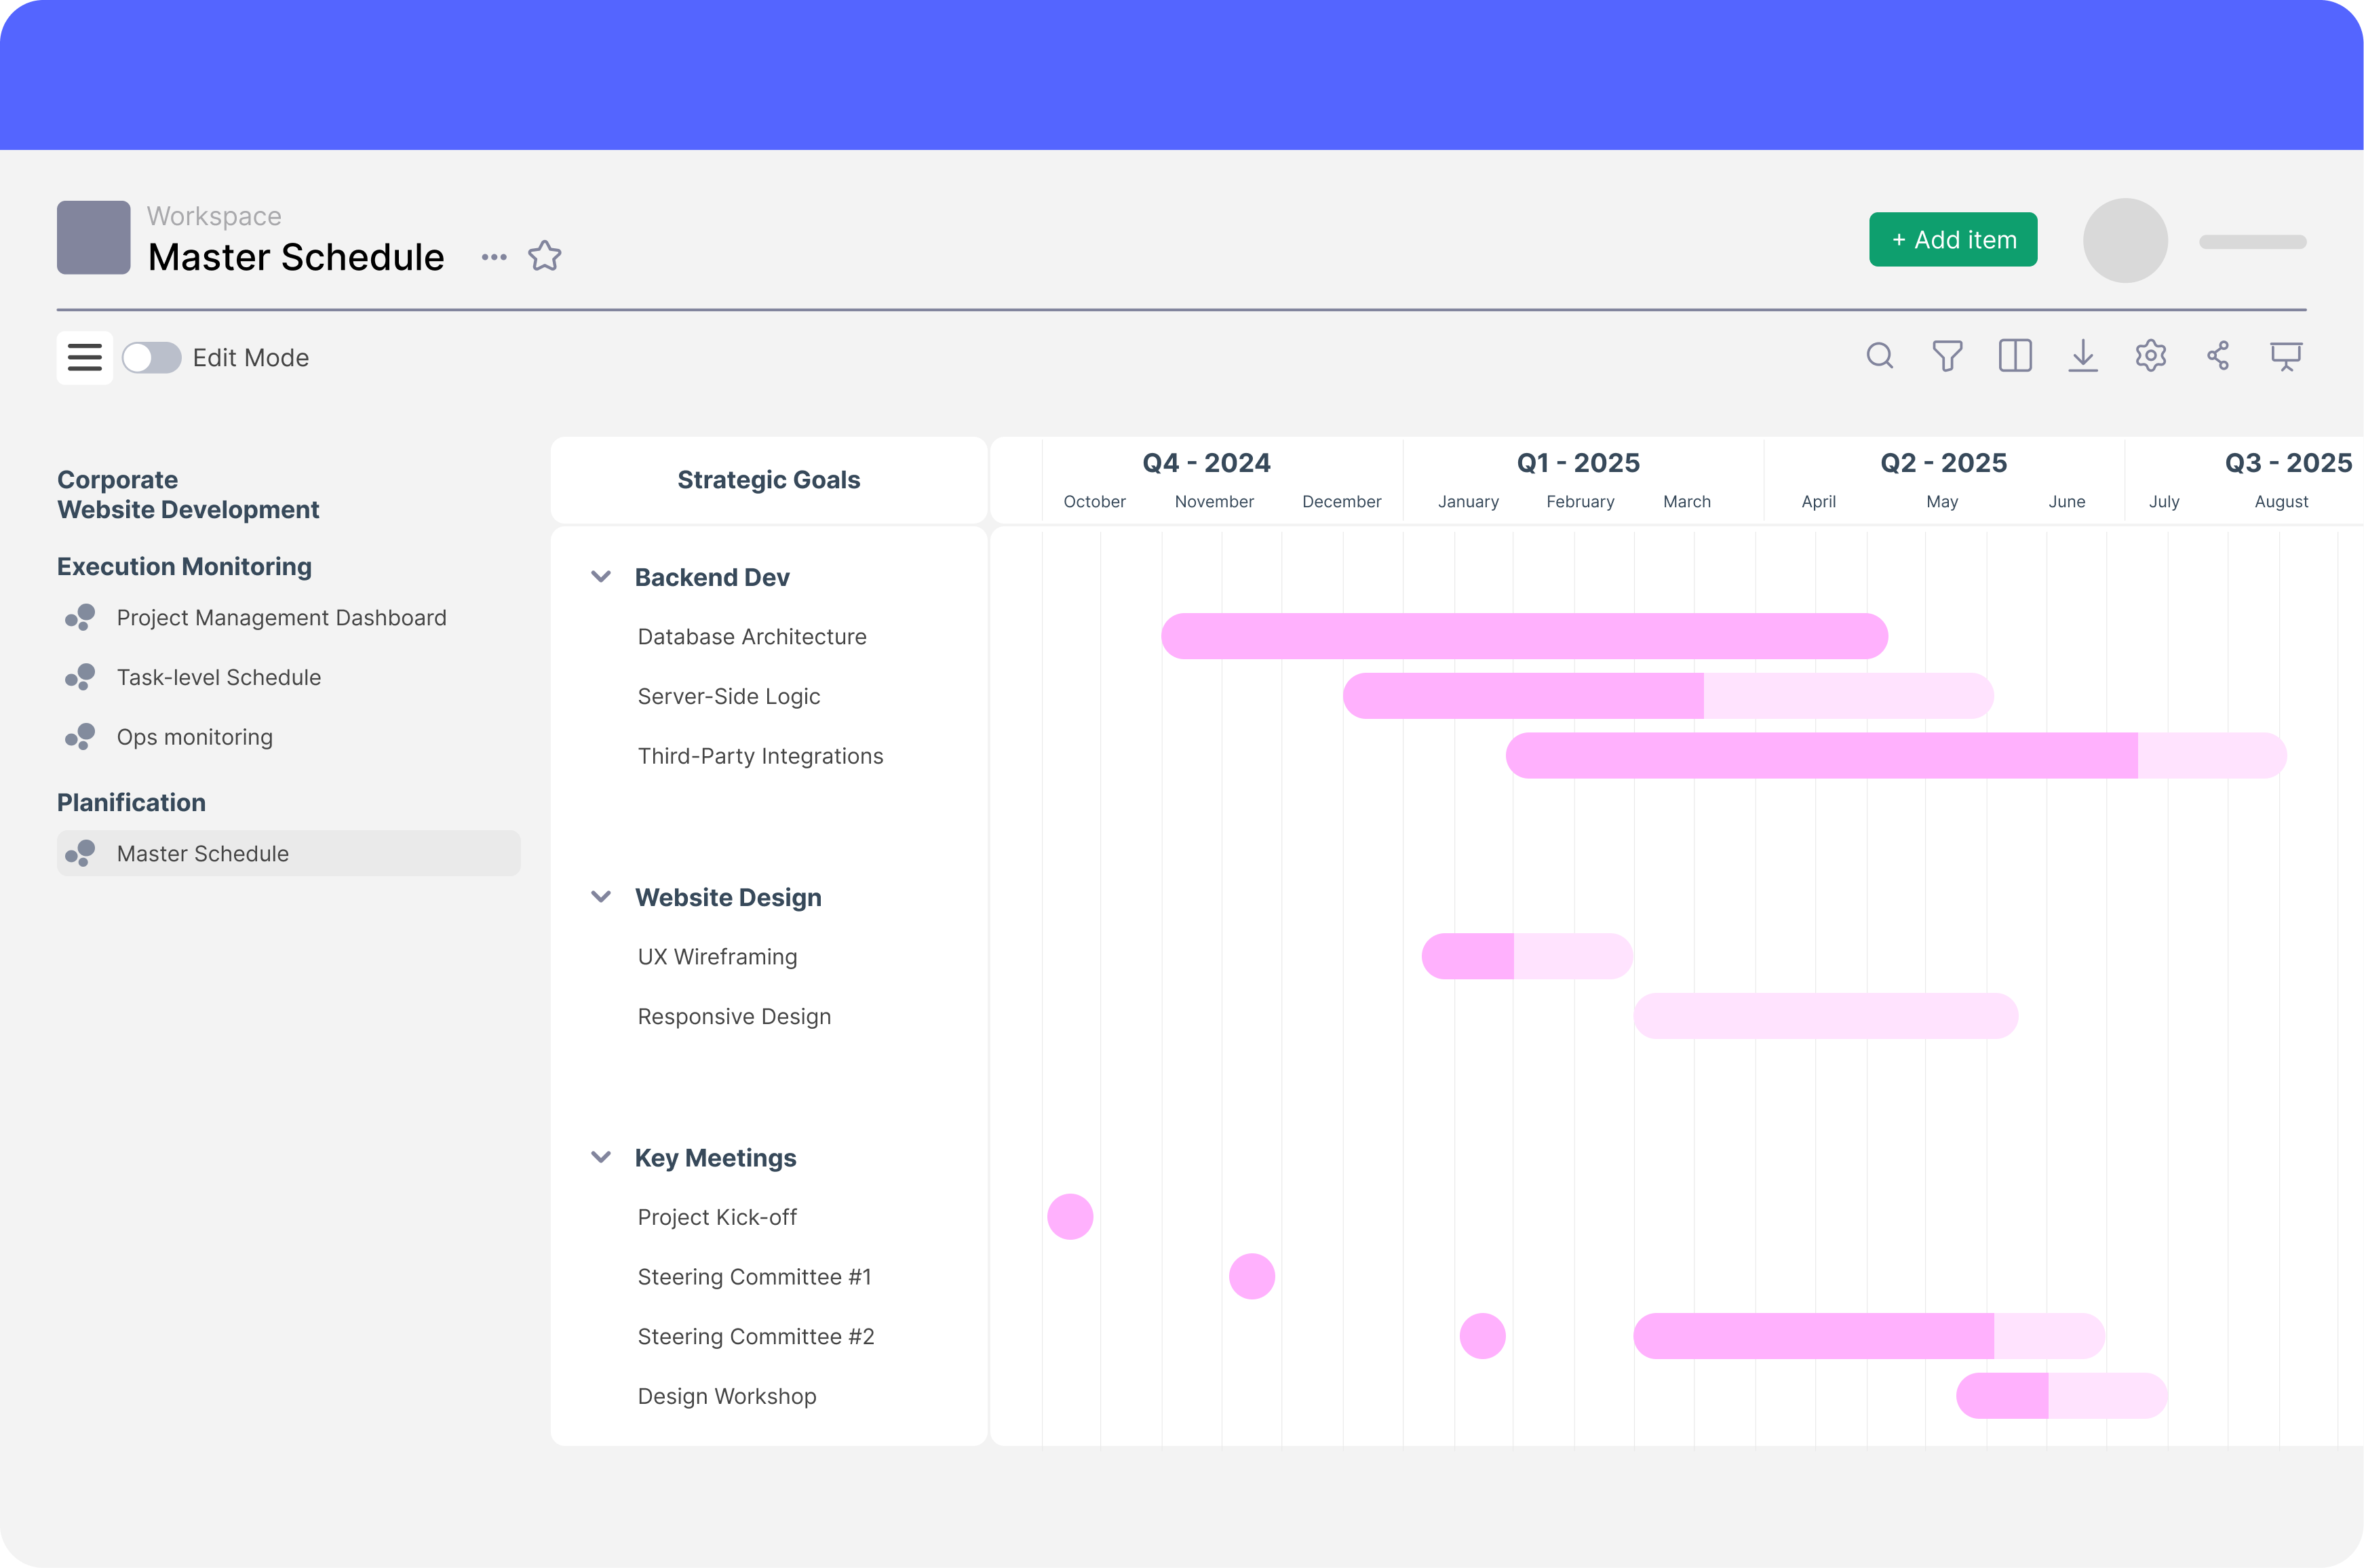
- Anticipate bottlenecks with dependency views for project actions (via Gantt charts)
- Enhance communication with stakeholders like Legal or Product teams via shared project pages. Give them read-only access for updates or editor access to contribute
How can I prove to management that my team is effective without spending hours on slides?
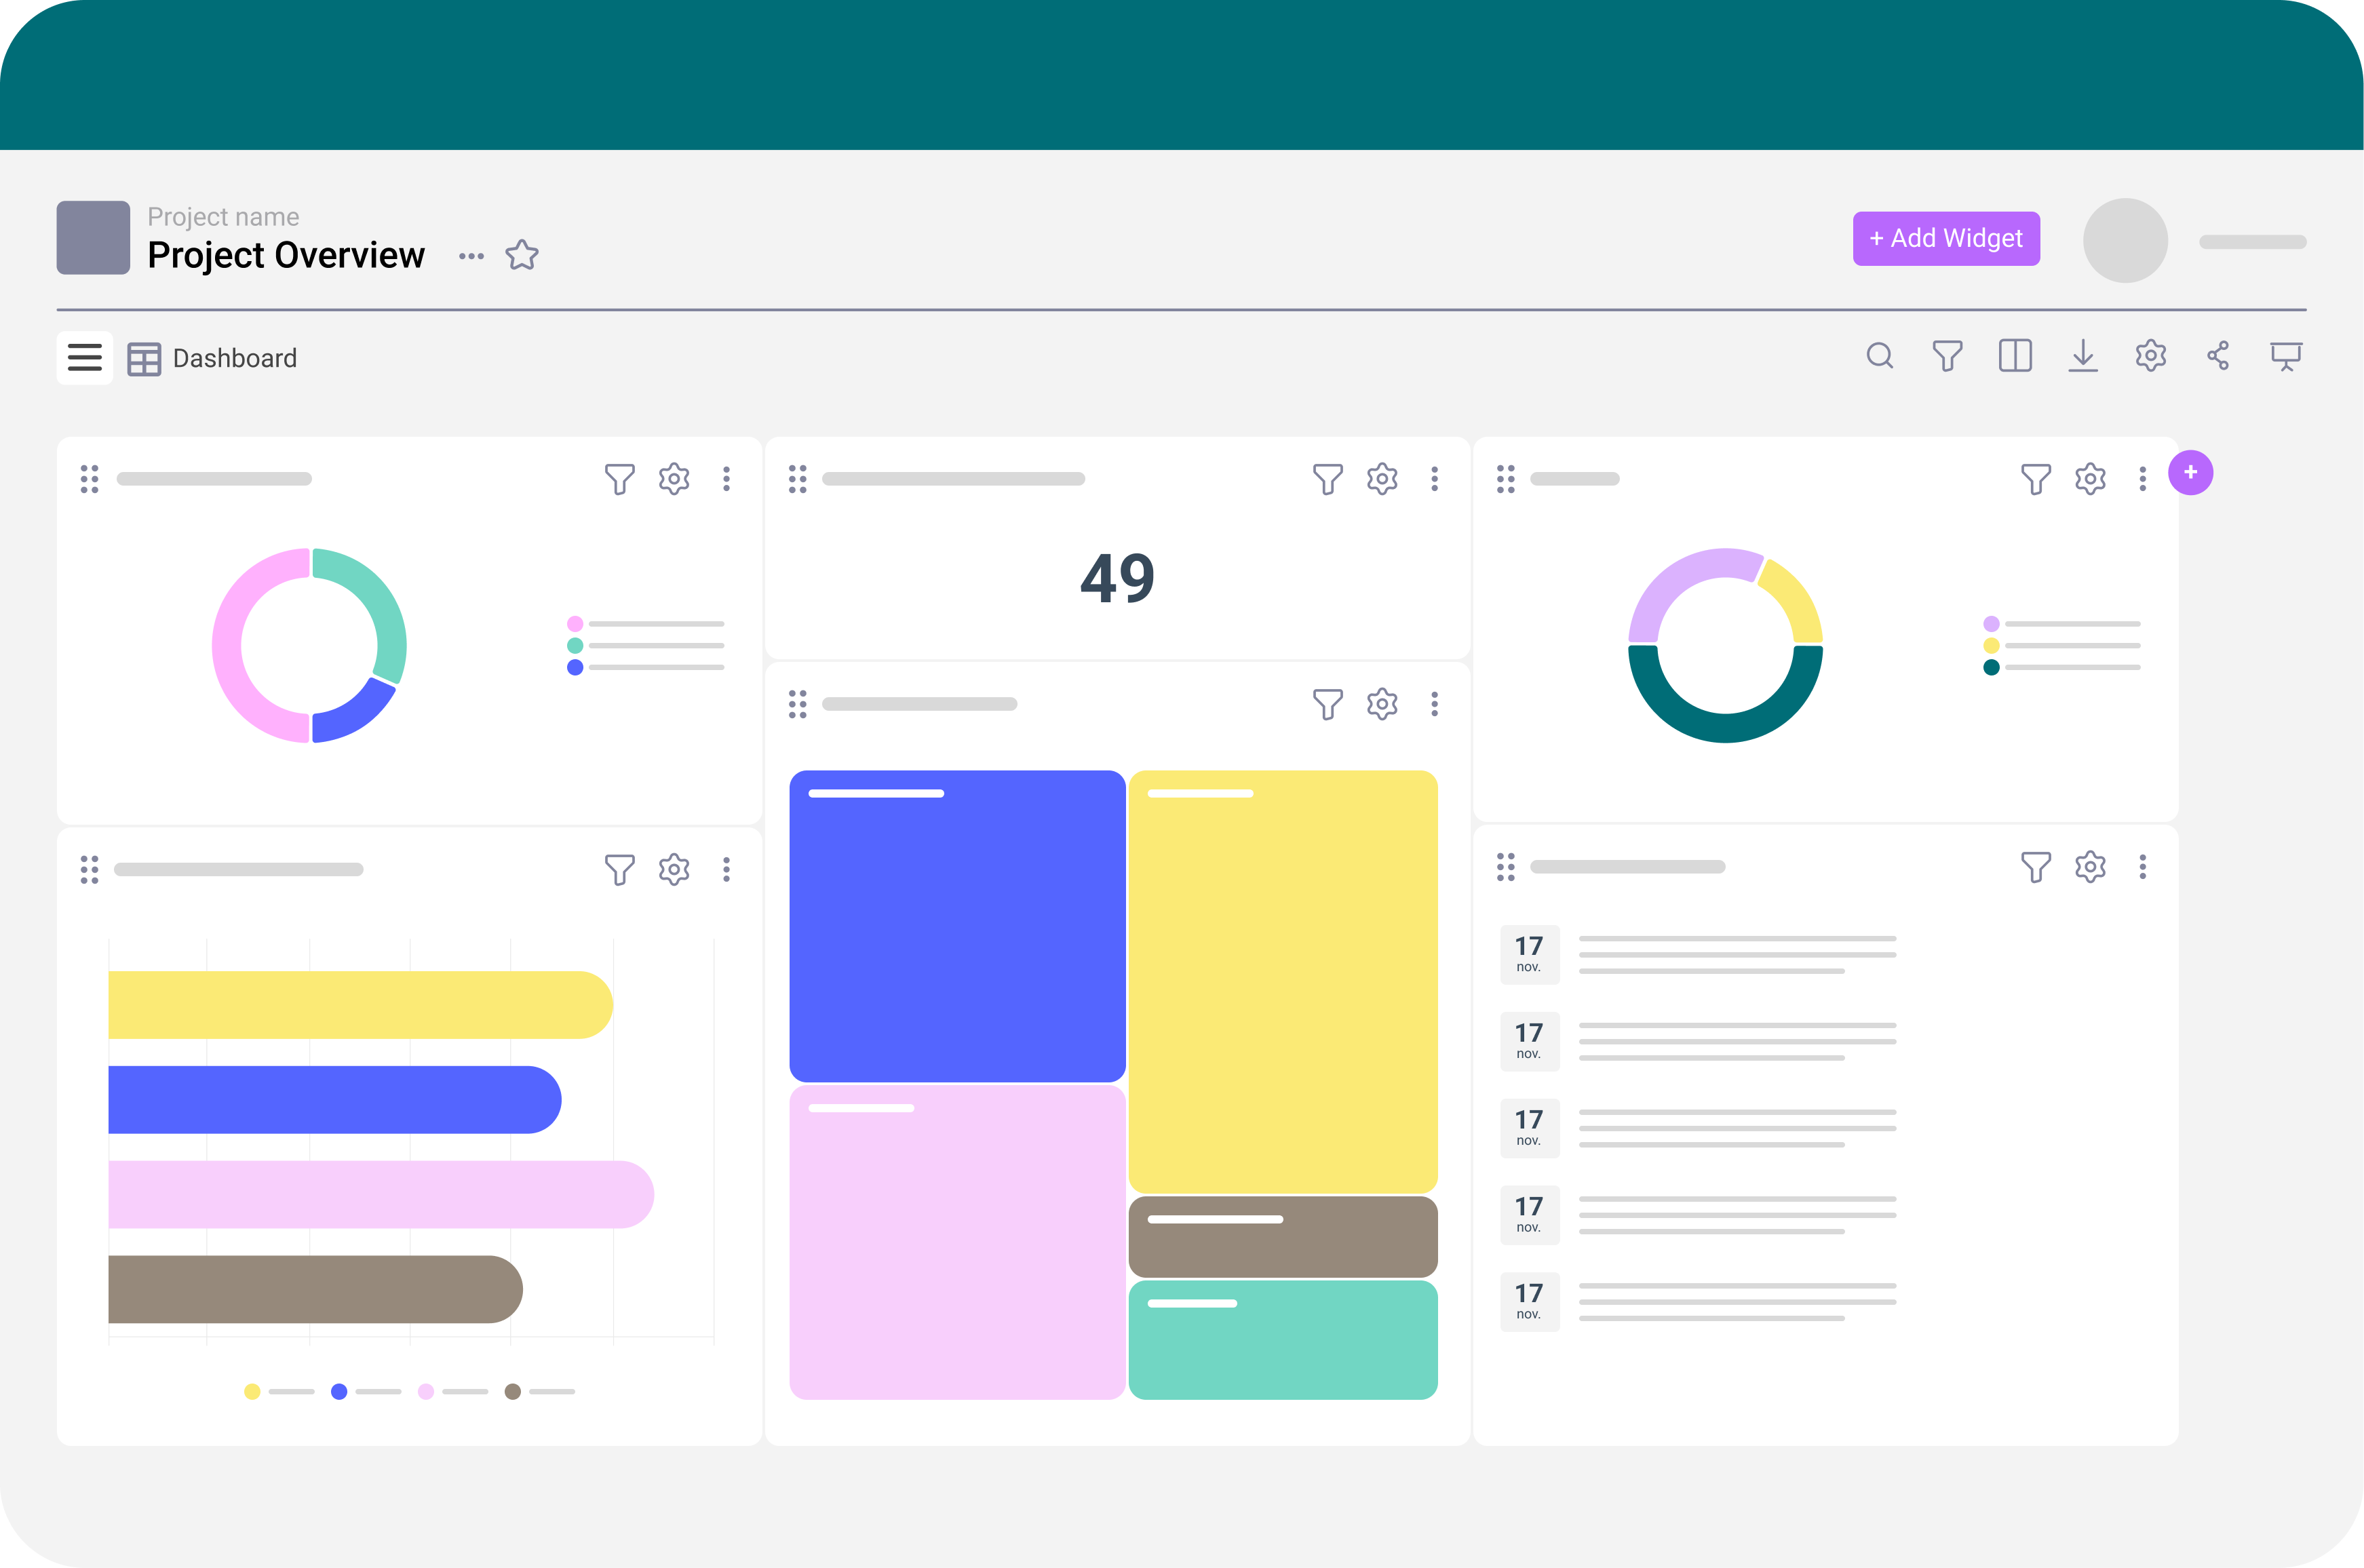
With Suivi, build dashboards to visualize key KPIs and generate slides in a single click.
Even better: project slides directly from the platform for instant reporting!
Decision-making at the management level has never been easier.
My team’s schedule is chaotic. Is the Calendar/Gantt view easy to update?
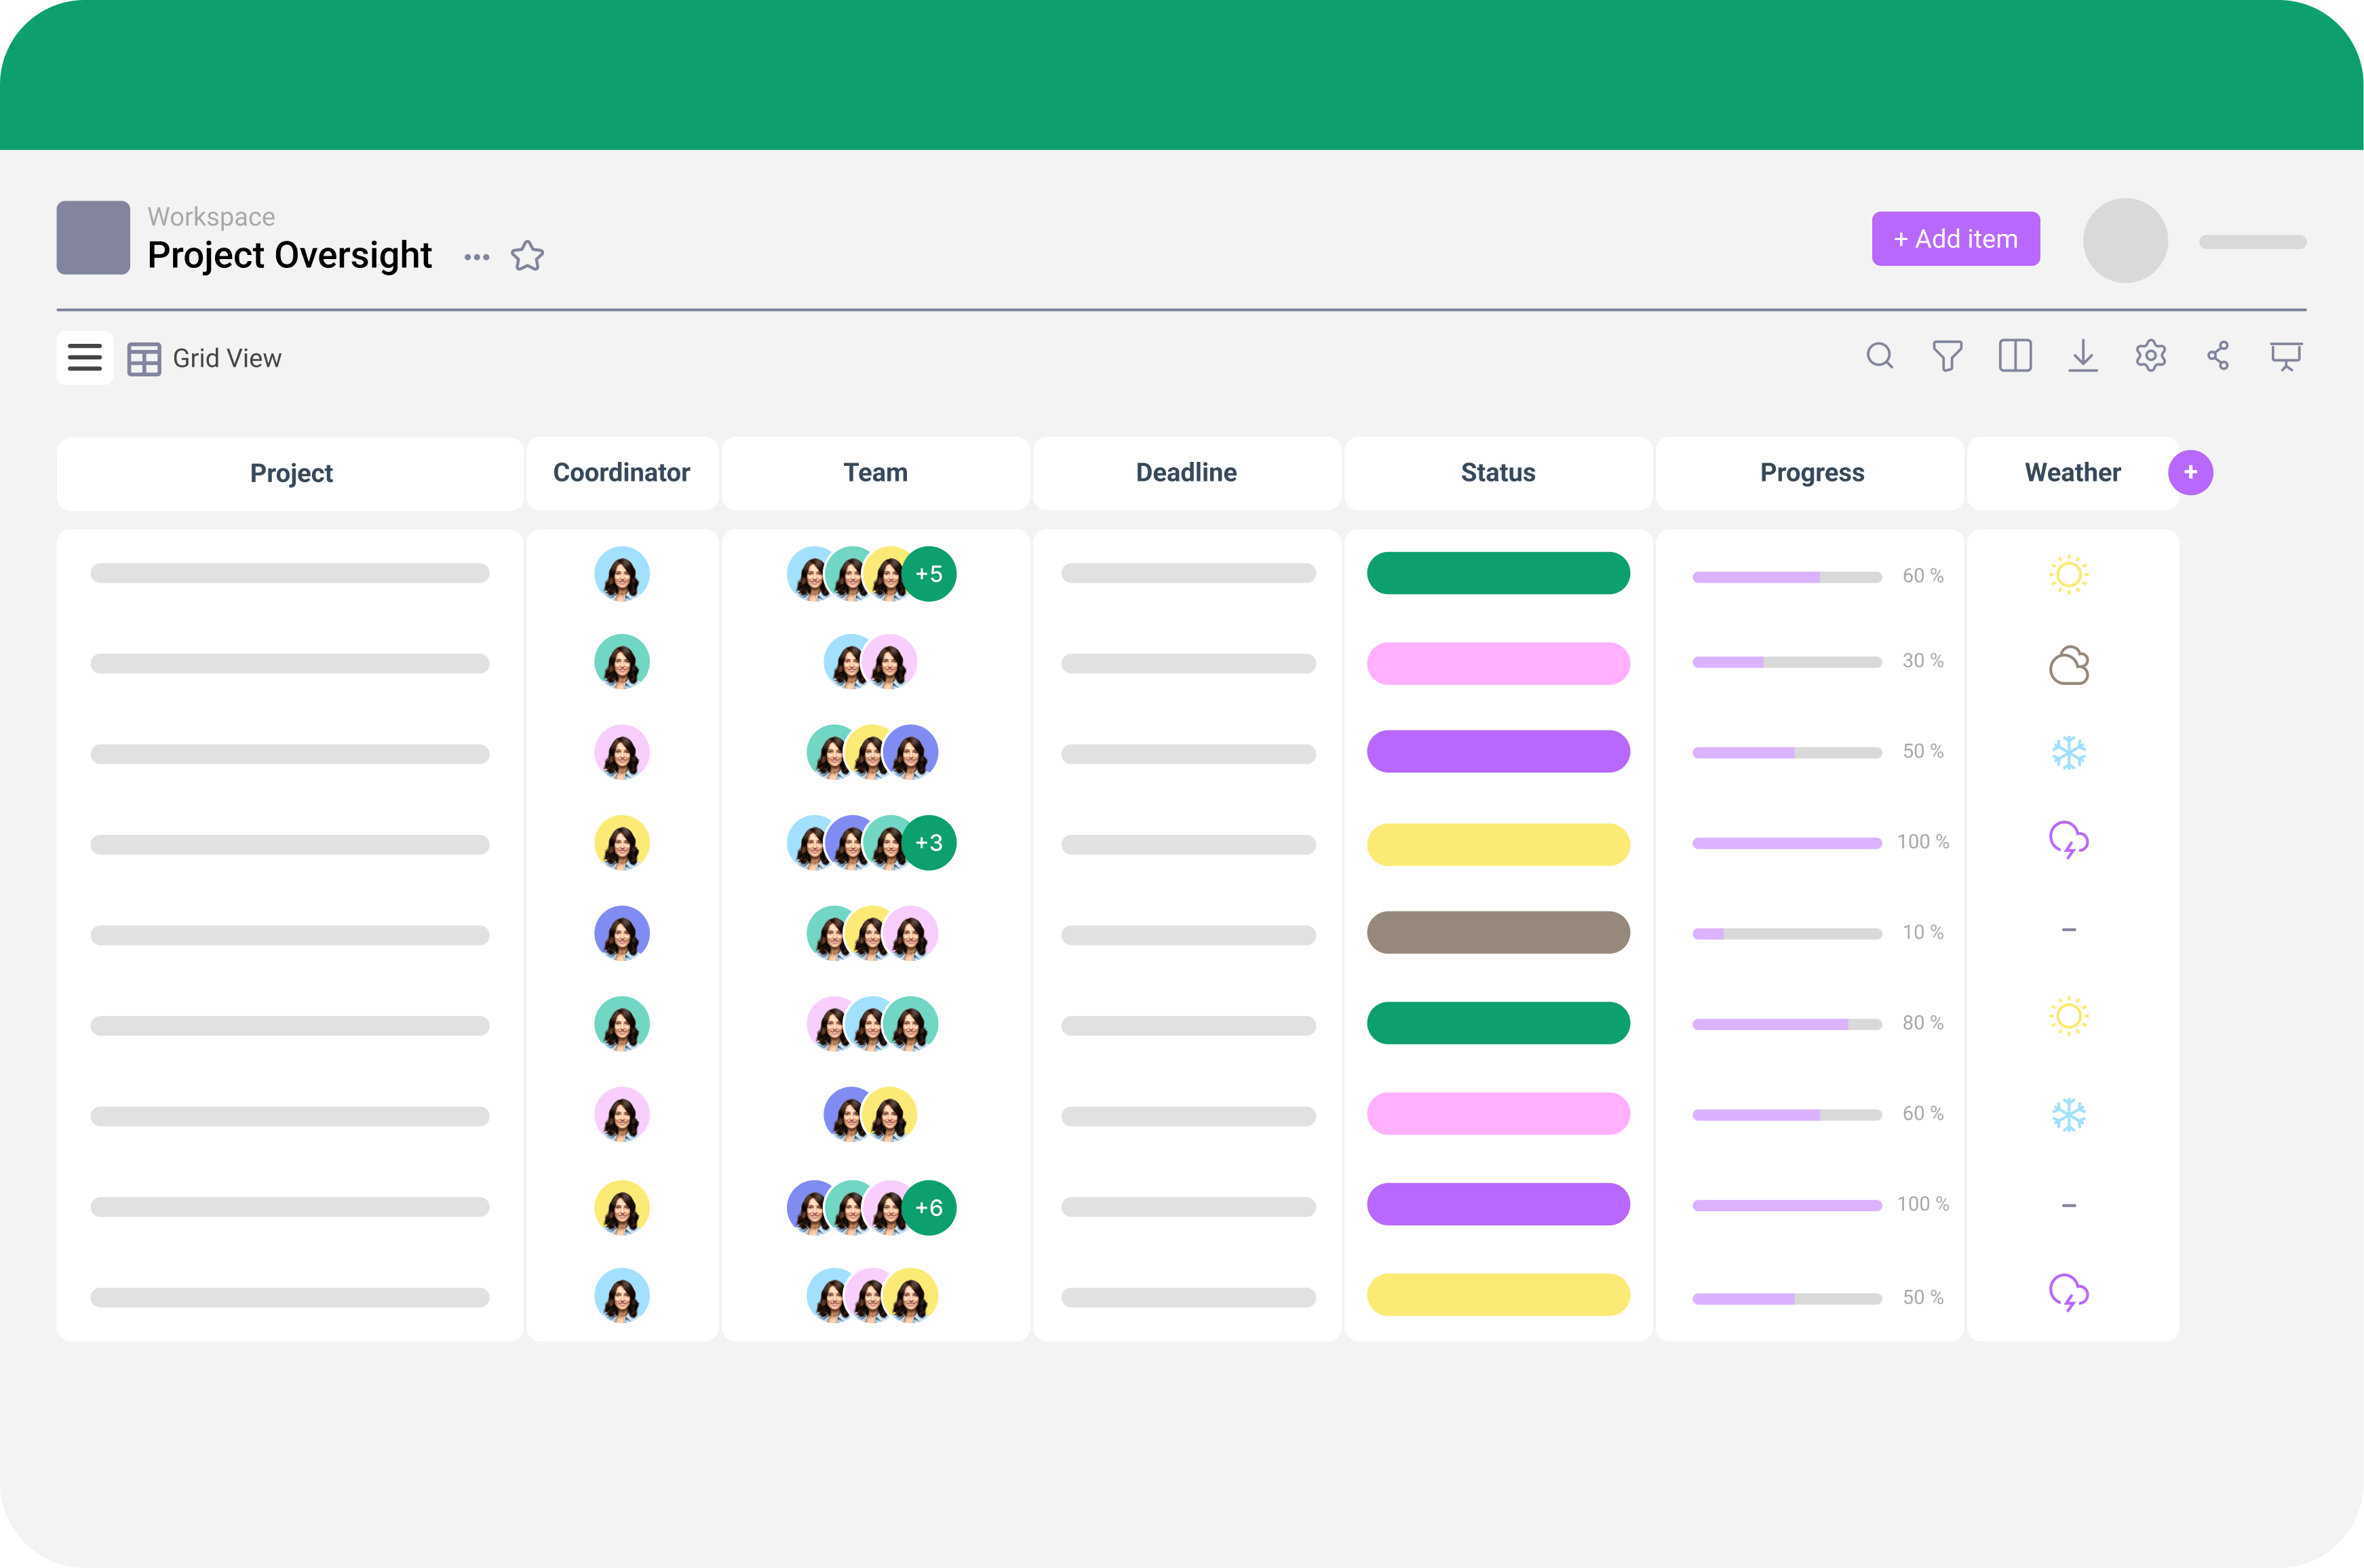
Absolutely! Any user with editor access can update schedules in real time from desktop or mobile.
Set precise permissions for who can view or edit each attribute to avoid errors. Managers also get a global view of all tasks on one page, allowing them to coordinate and balance workload.
What’s the real productivity gain?
Why use a field service management tool if it doesn’t save time?
- Graphs, rankings, alerts: organize information faster
- Gantt view and dashboards help anticipate bottlenecks—no more wasted weeks
- No need to copy info between tools; everything is centralized
- Quickly adjust schedules and share them with your team
- Keep management informed without spending hours building slides
All the keys to boost service productivity and cut costs!
Can my team create new field reports without IT support?
Yes – any user with editor access can generate new forms directly in the platform.
